
Credits: Token Terminal
Well, no. Let’s explore the state of crypto through the lens of fundamentals.
- We’ll analyse the crypto market w/ the following metrics:
- 1⃣Fees
- 2⃣Revenue
- 3⃣Token incentives
- 4⃣Earnings
- 5⃣P/F ratio
- 6⃣P/S ratio
- 7⃣Daily active users
- 8⃣Active developers
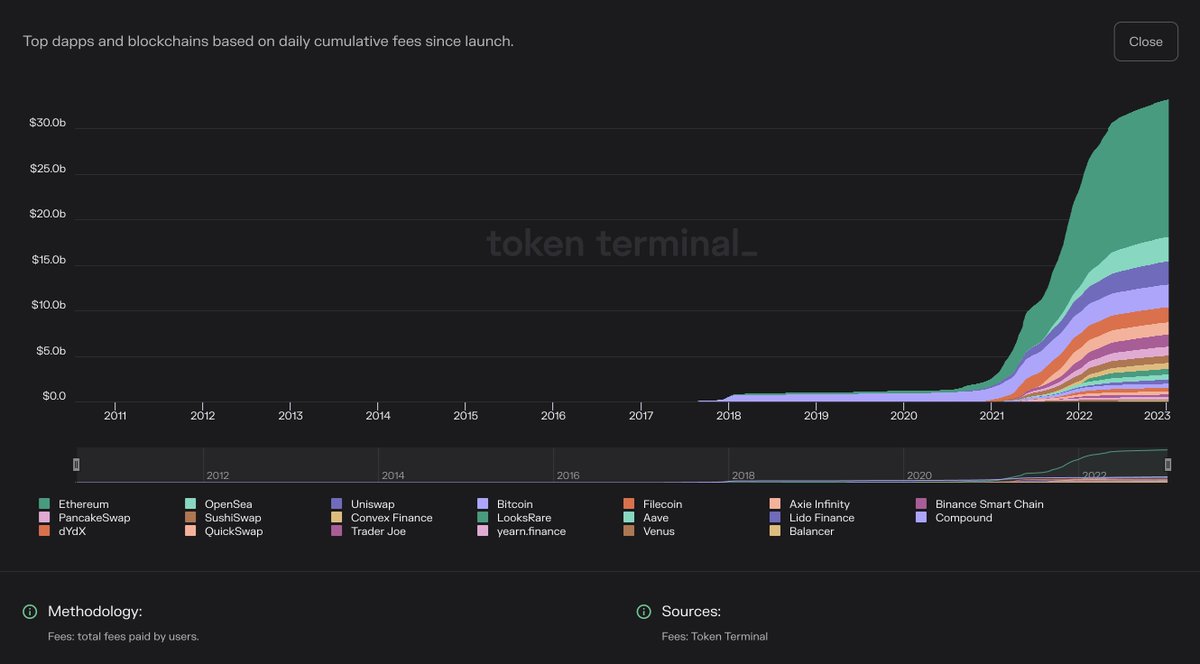
Fees: This metric tells us how much end users are willing to pay for the service that a protocol provides. Examples: – Blockchains = transaction fees – DEXs = trading fees – Lending protocols = interest – NFT marketplaces = royalties and marketplace fees


Cumulative fees: To date, the crypto market has generated ~$33B in aggregate fees.
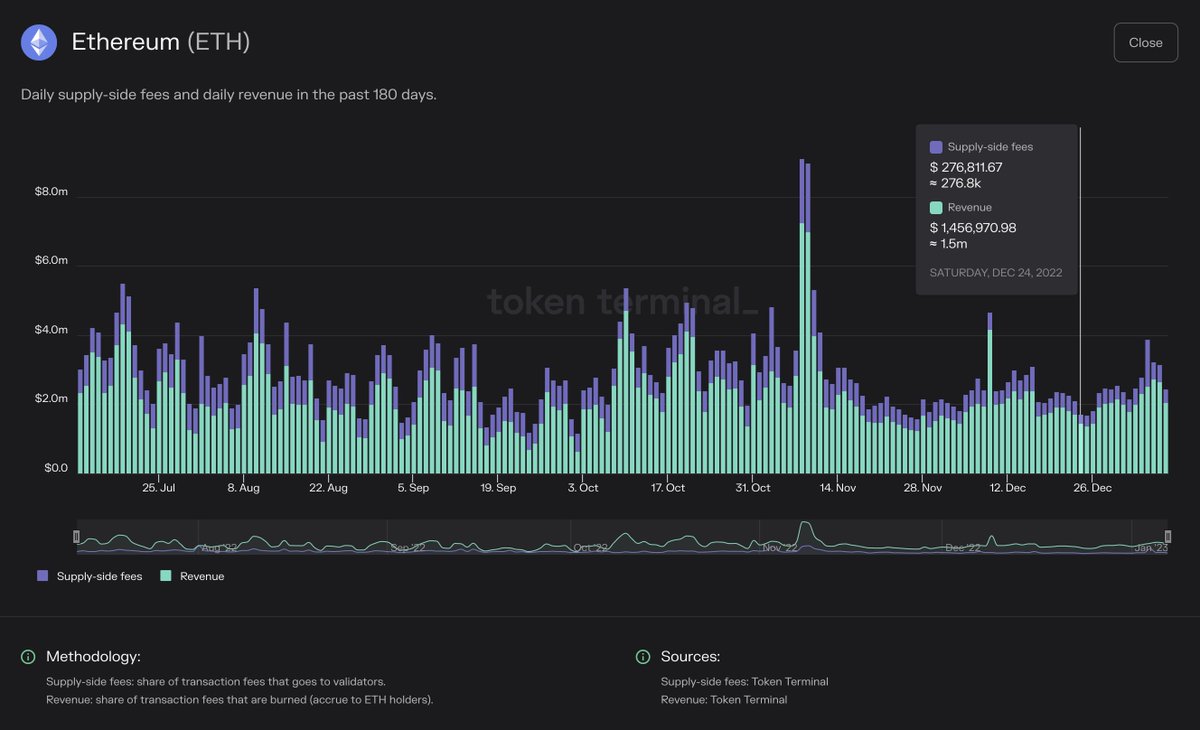
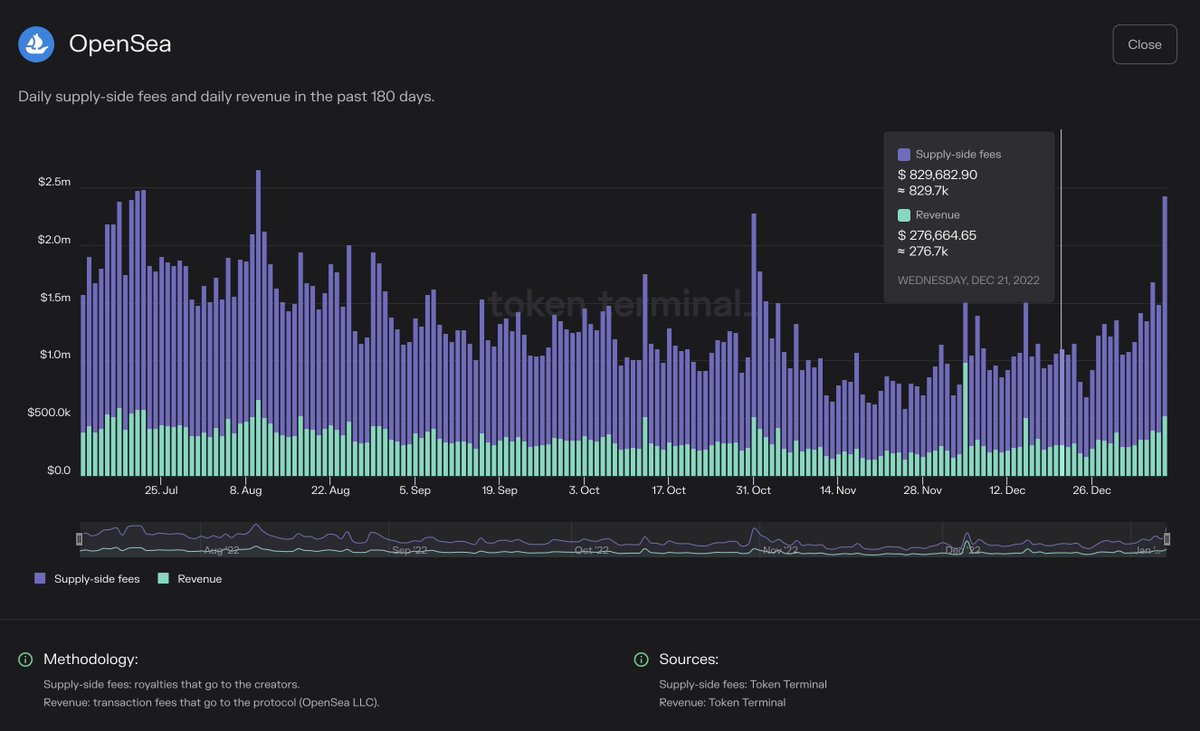
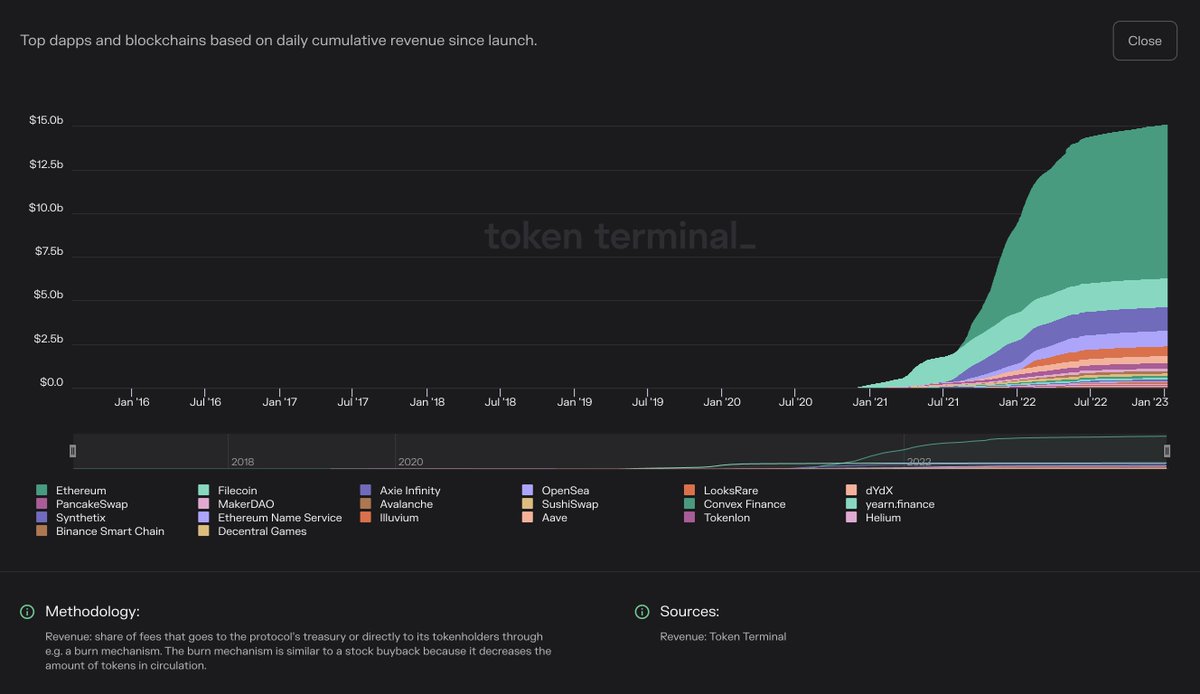
Revenue: This metric tells us how much the protocol captures of the fees paid by end users, which means that it’s always some % of the fees.


Cumulative revenue to date: To date, the crypto market has generated ~$15B in aggregate revenue.
Token incentives; This metric tells how much the protocol spends on user acquisition by issuing & distributing its governance tokens to users. It’s worthwhile to analyse this metric as a % of revenue, to get a sense of the economic sustainability of a protocol.
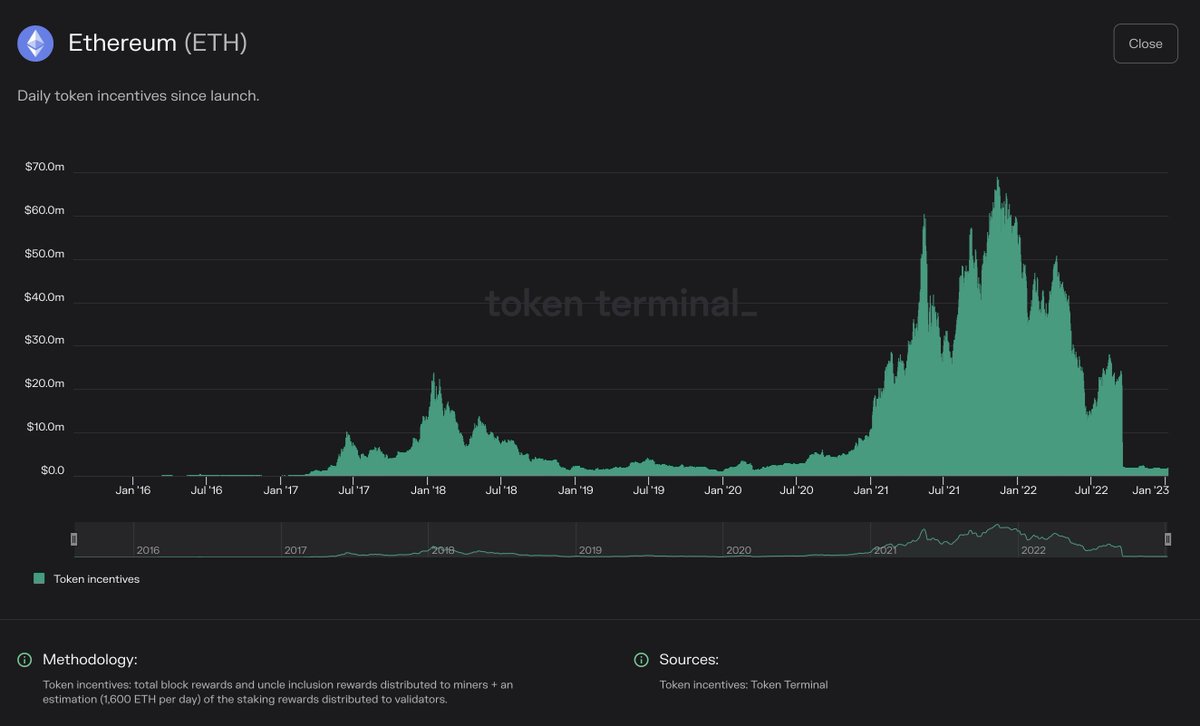
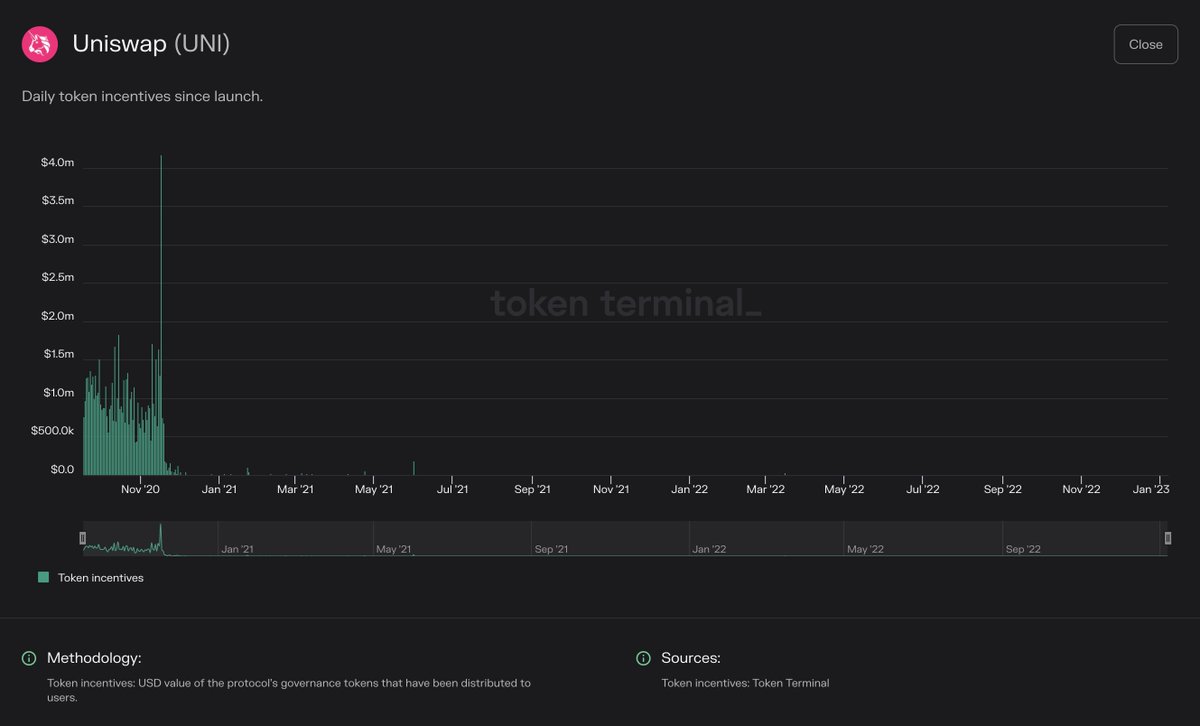
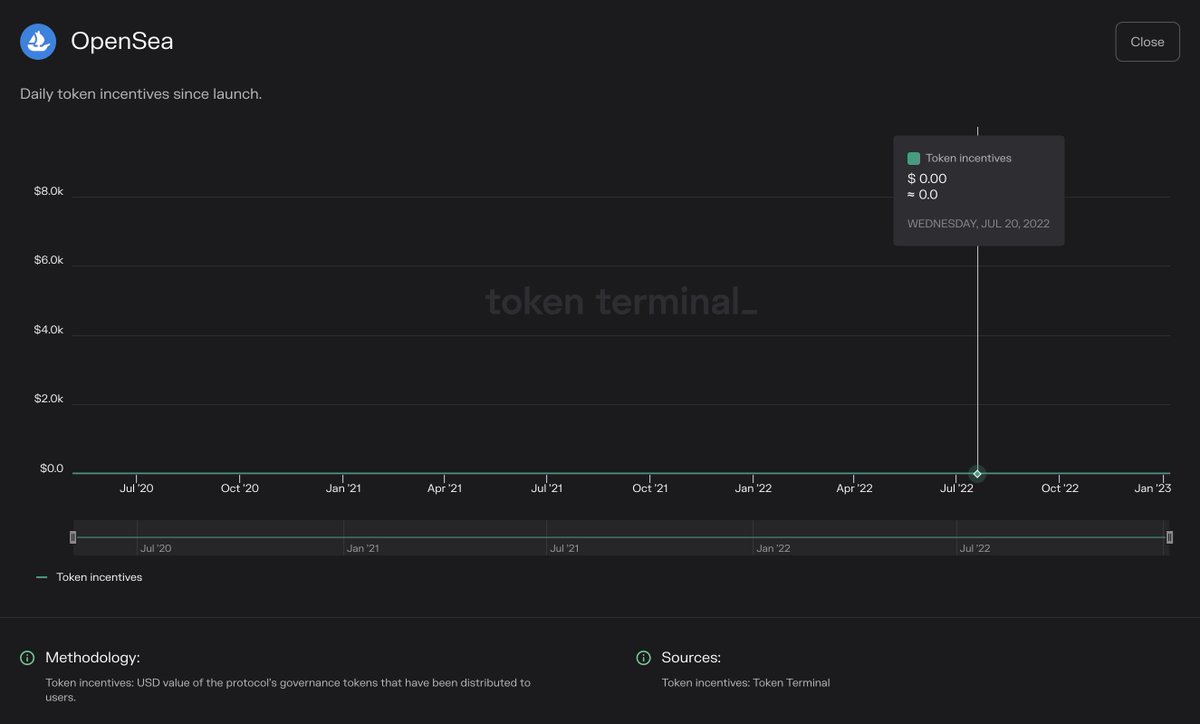
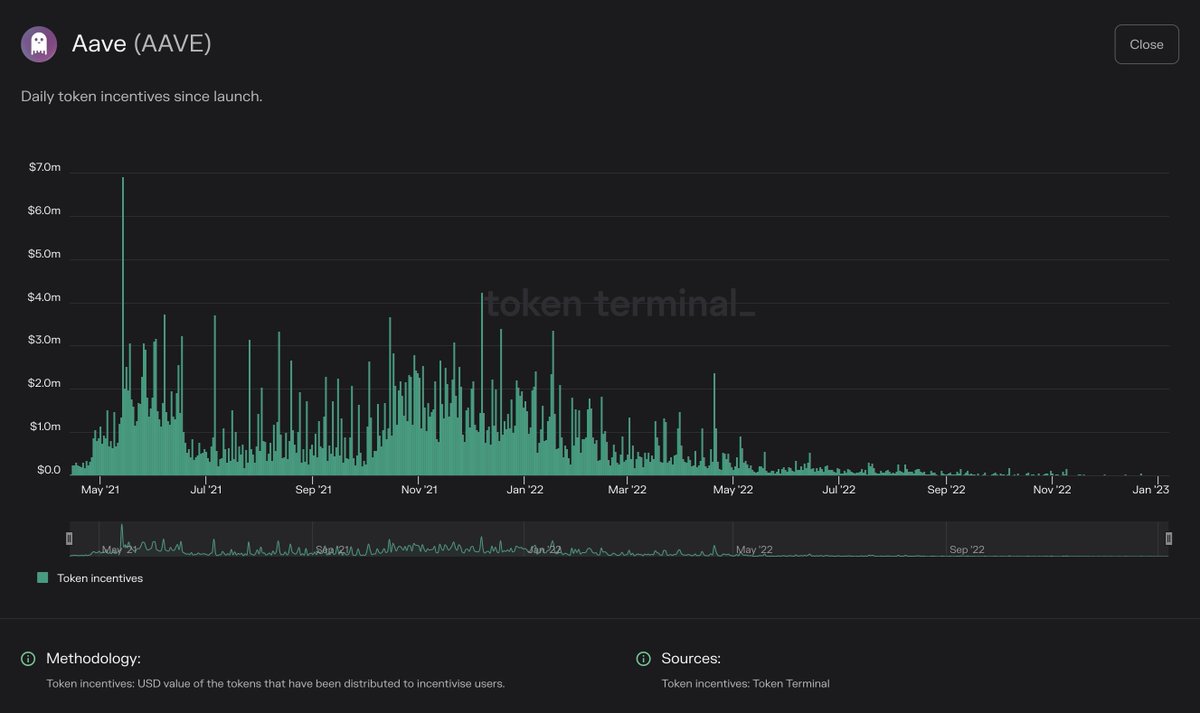
Cumulative token incentives to date: To date, the crypto market has spent ~$100B+ in aggregate on token incentives.
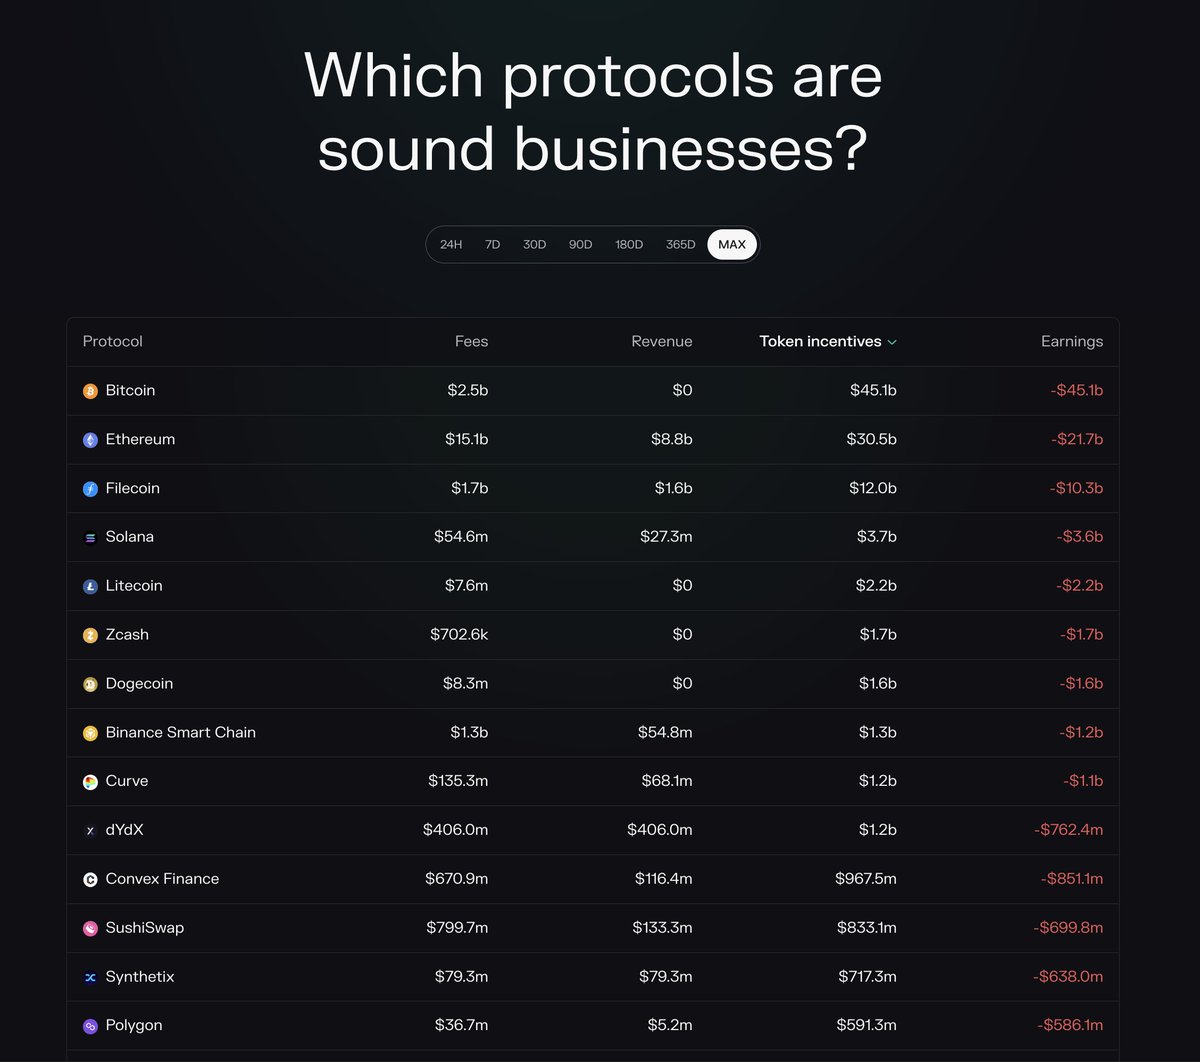
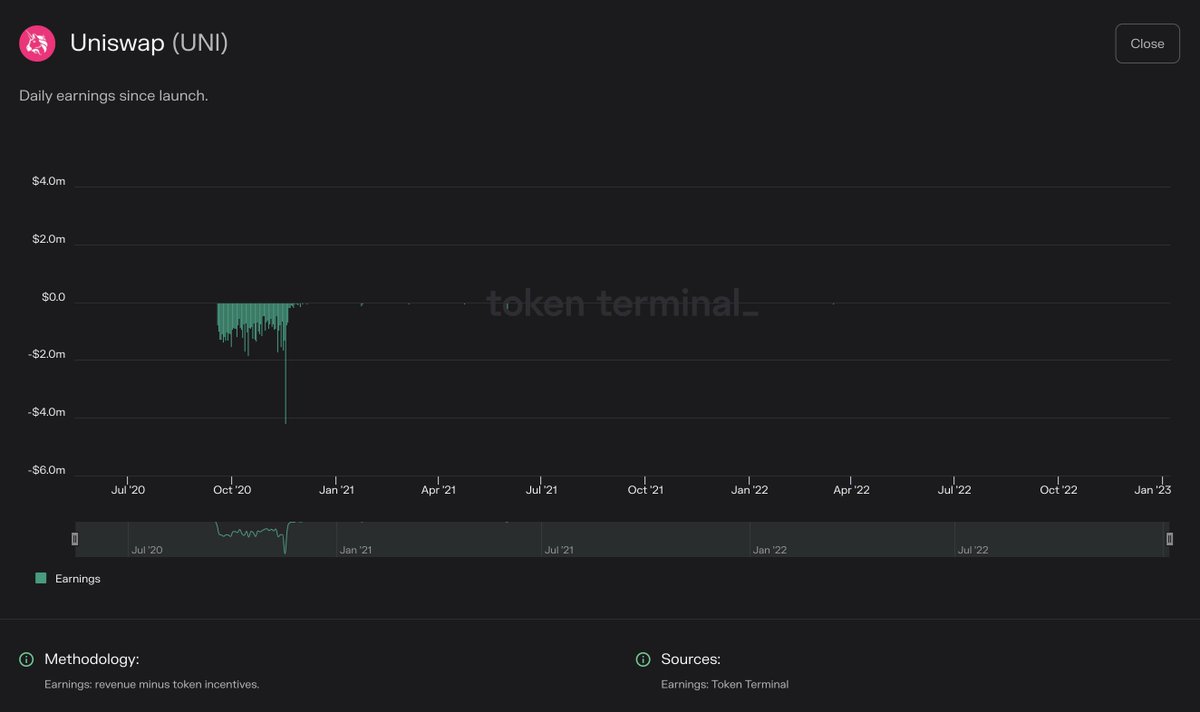
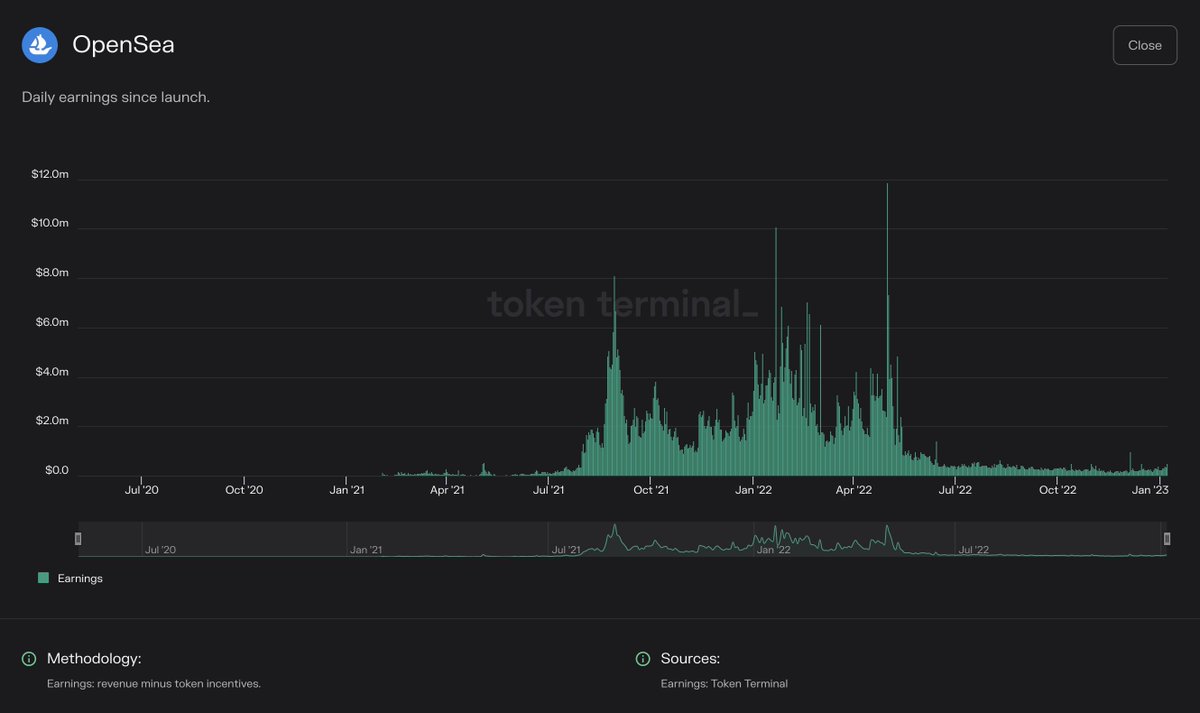
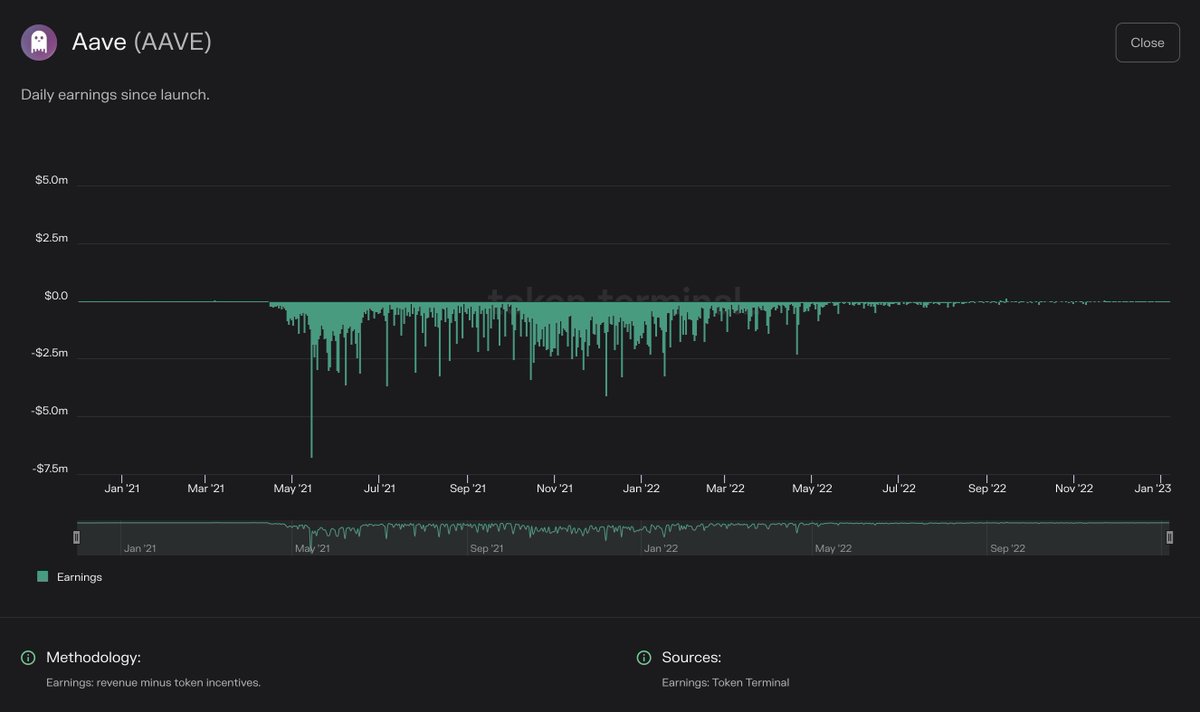
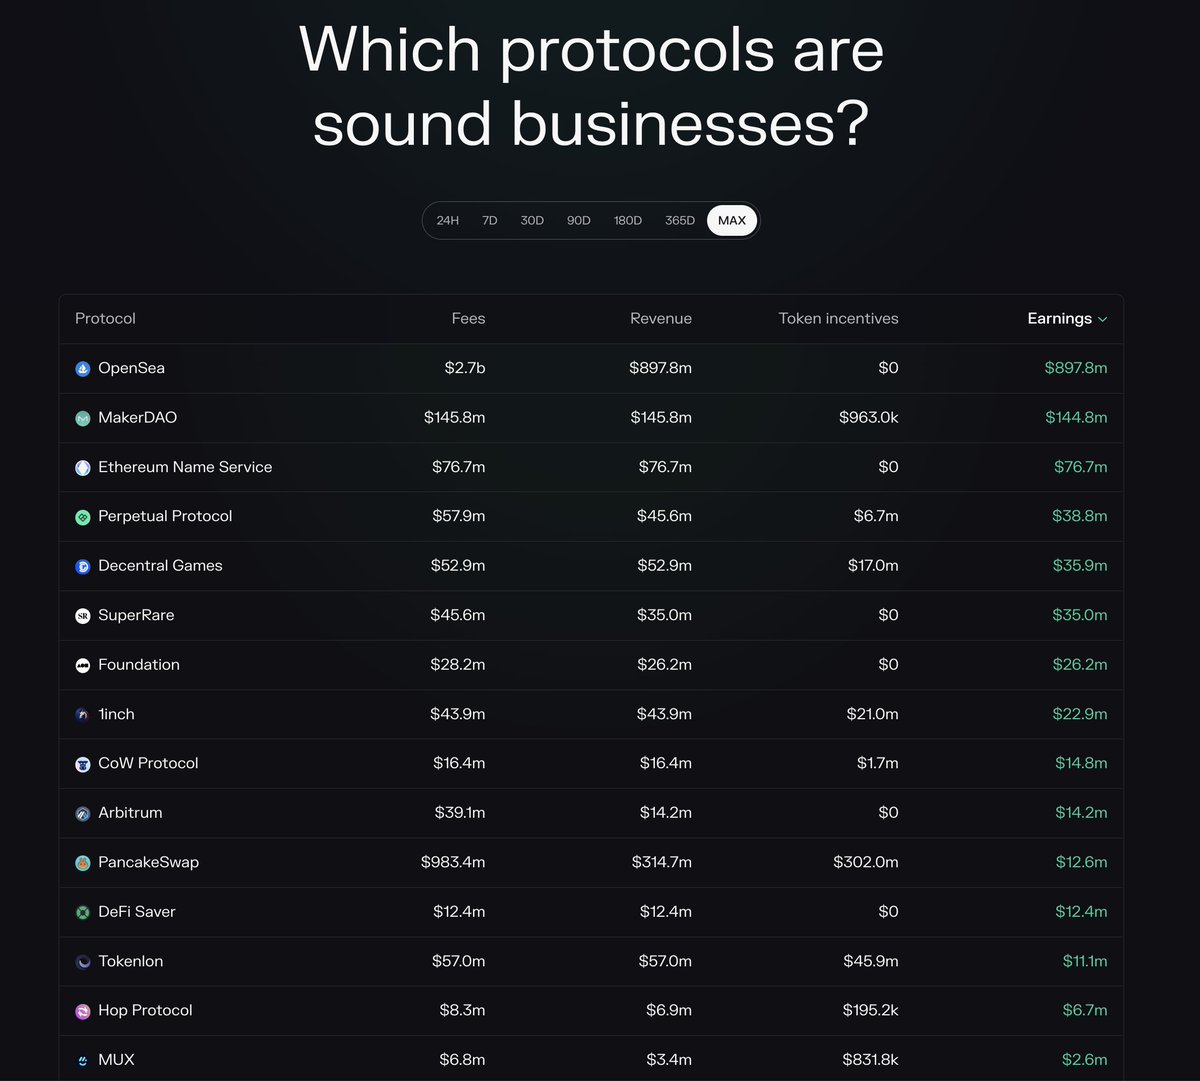
Earnings: This metric tells us how much the protocol has left of the revenue after subtracting the token incentives. This metric should still be subtracted by the operational expenses of the DAO to arrive at a true net income figure.

Cumulative earnings to date: To date, the crypto market has generated ~$1B+ in aggregate earnings.
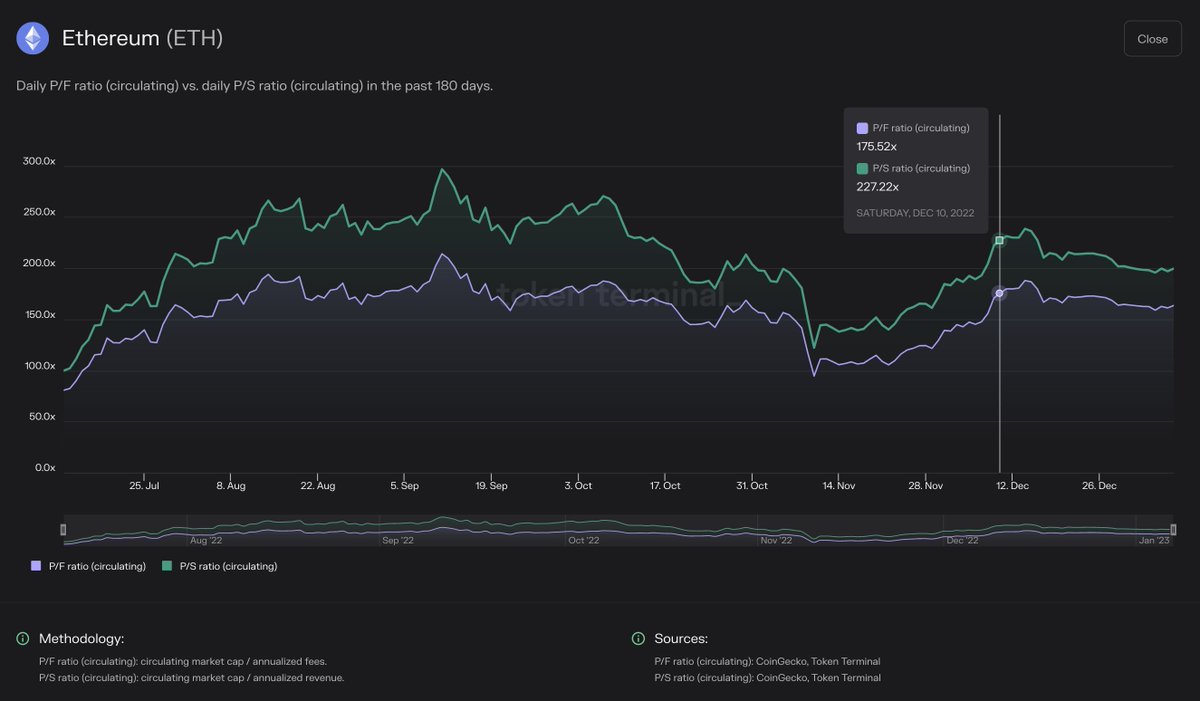
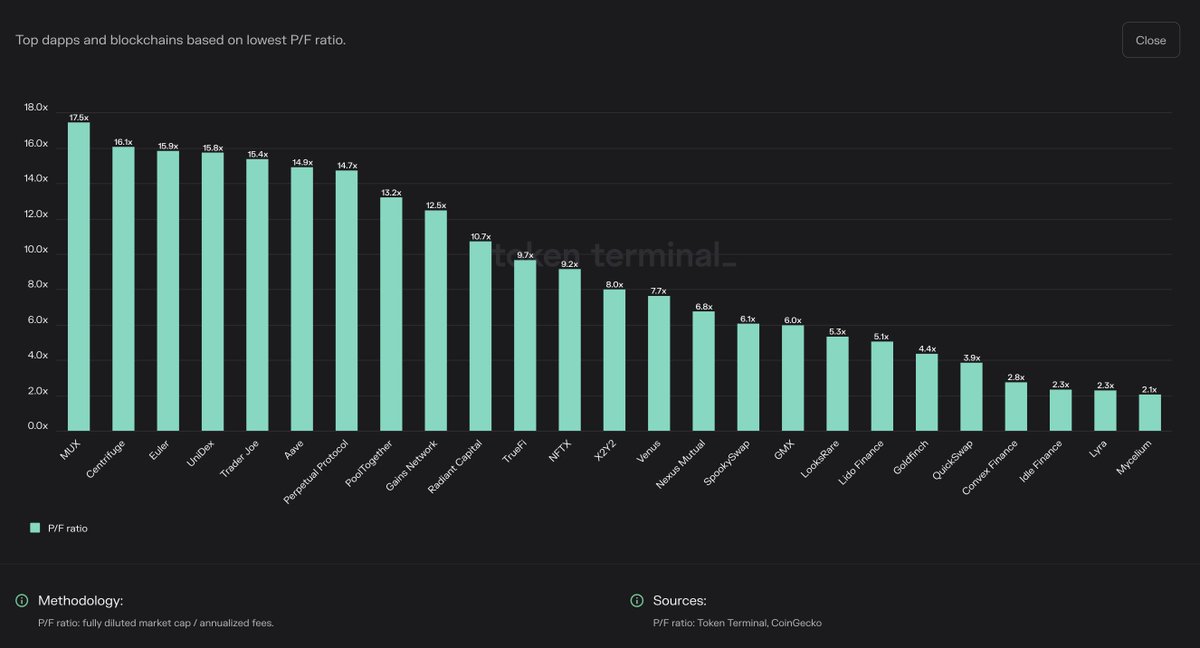
Price to fees (P/F) ratio: This metric tells us the relationship between a protocol’s market capitalisation and the fees it generates per year. All things equal, a lower ratio is usually better from an investor’s point of view.
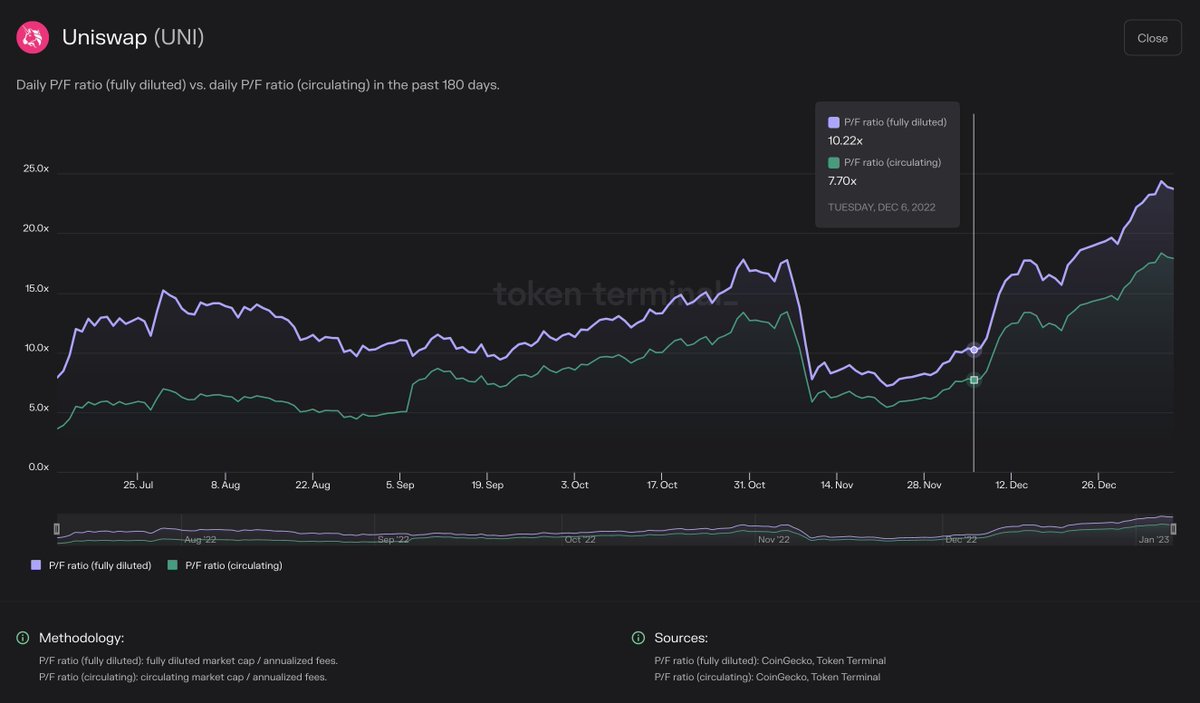

Snapshot of the latest P/F ratios: Currently, there are 15 protocols with a P/F ratio below 10.00x.
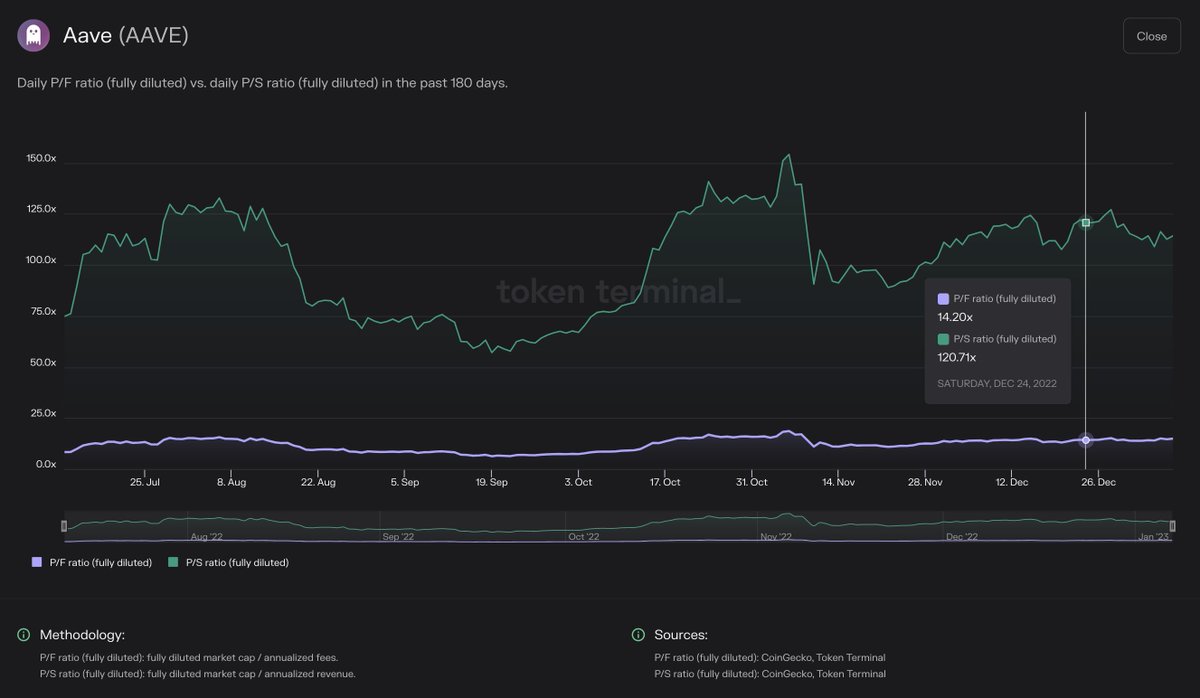
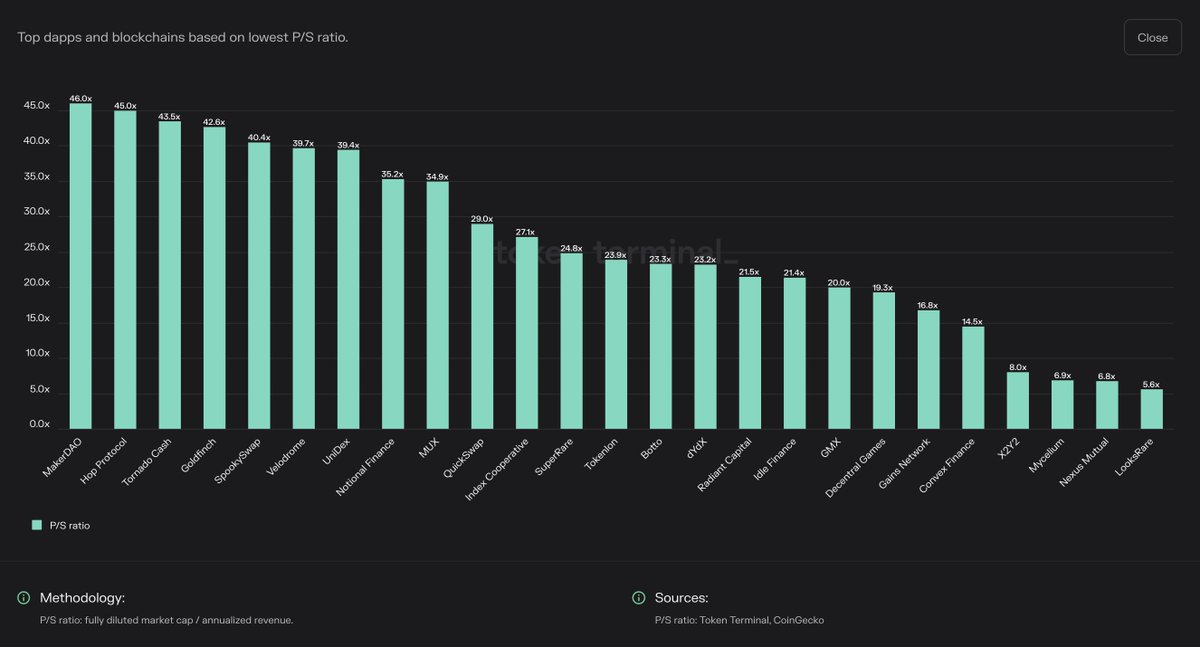
Price to sales (P/S) ratio: This metric tells us the relationship between a protocol’s market capitalisation and the revenue it generates per year. All things equal, a lower ratio is usually better from an investor’s point of view.


Snapshot of the latest P/S ratios: Currently, there are 4 protocols with a P/S ratio below 10.00x.
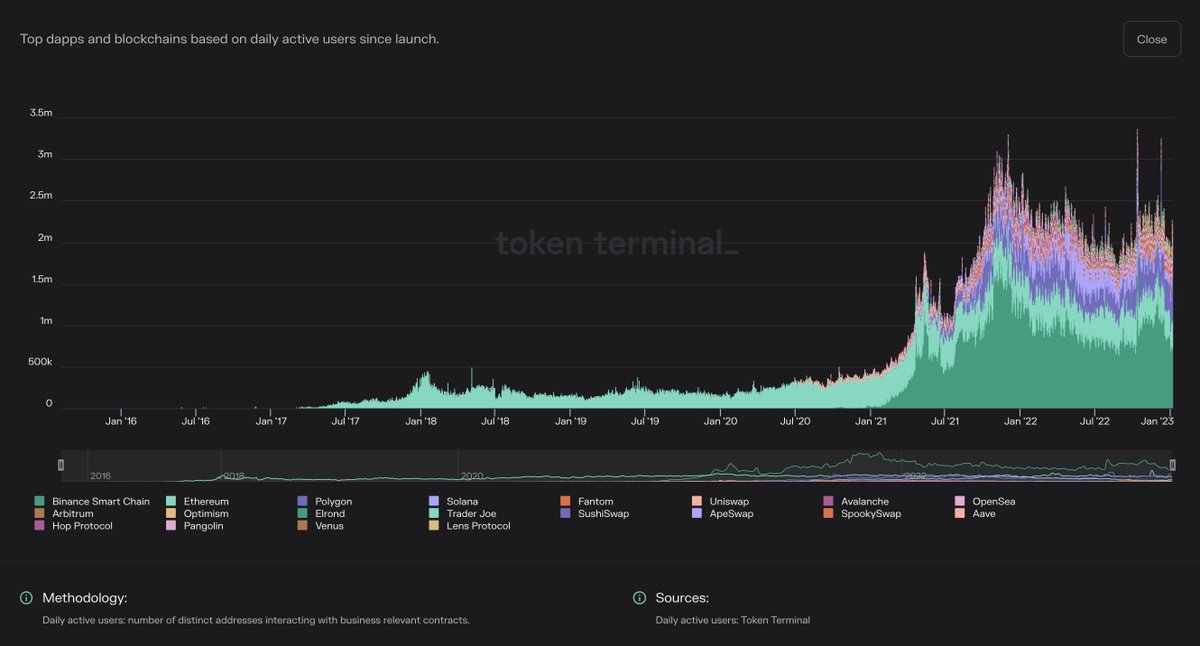
Daily active users: This metric tells us how many unique addresses call a protocol’s revenue-generating smart contract functions. DAUs should be viewed together w/ the fees metric to understand how much each DAU is paying (easier to have more users if the service is cheap).
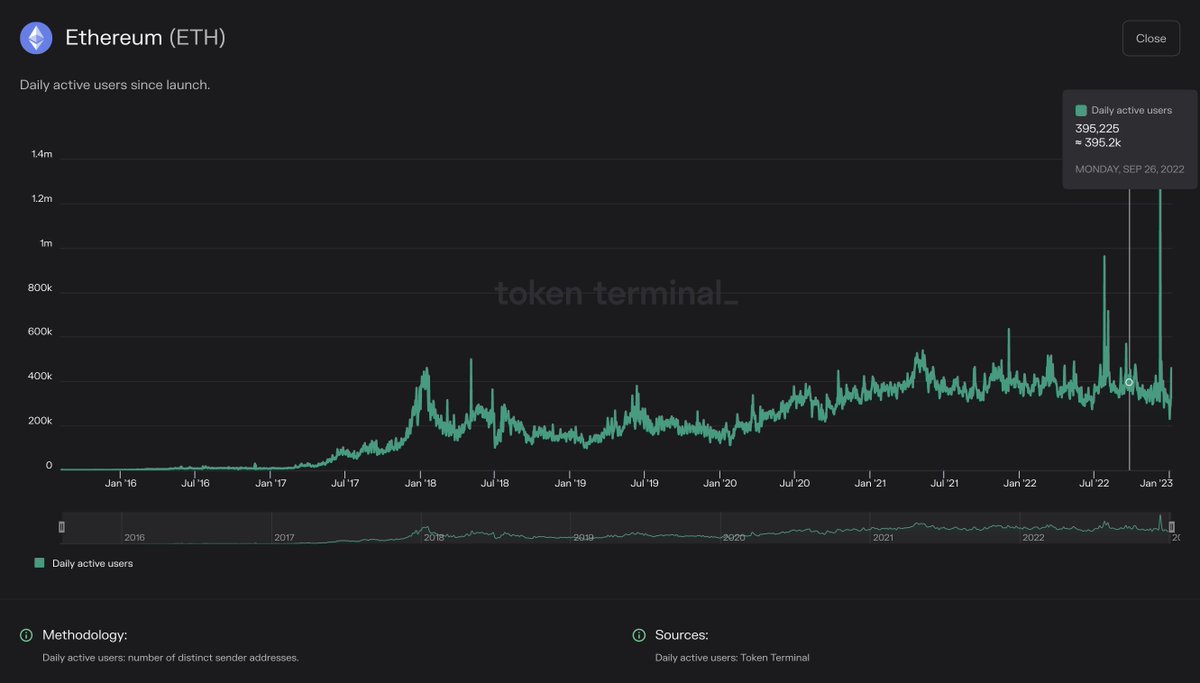
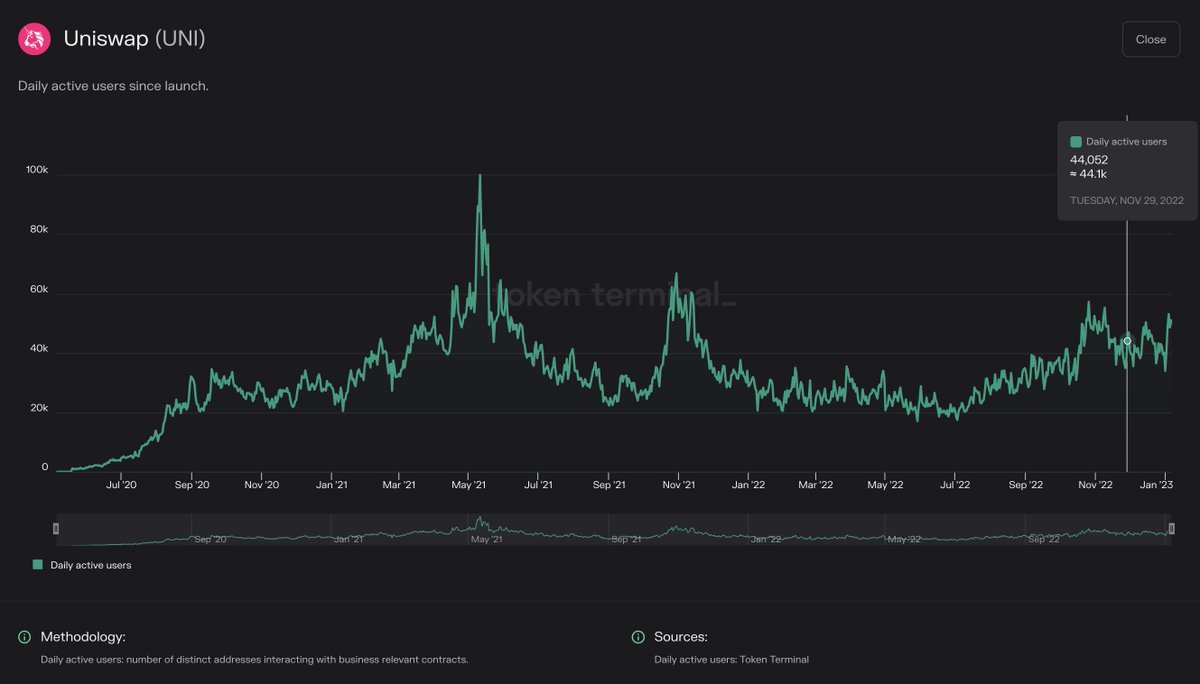
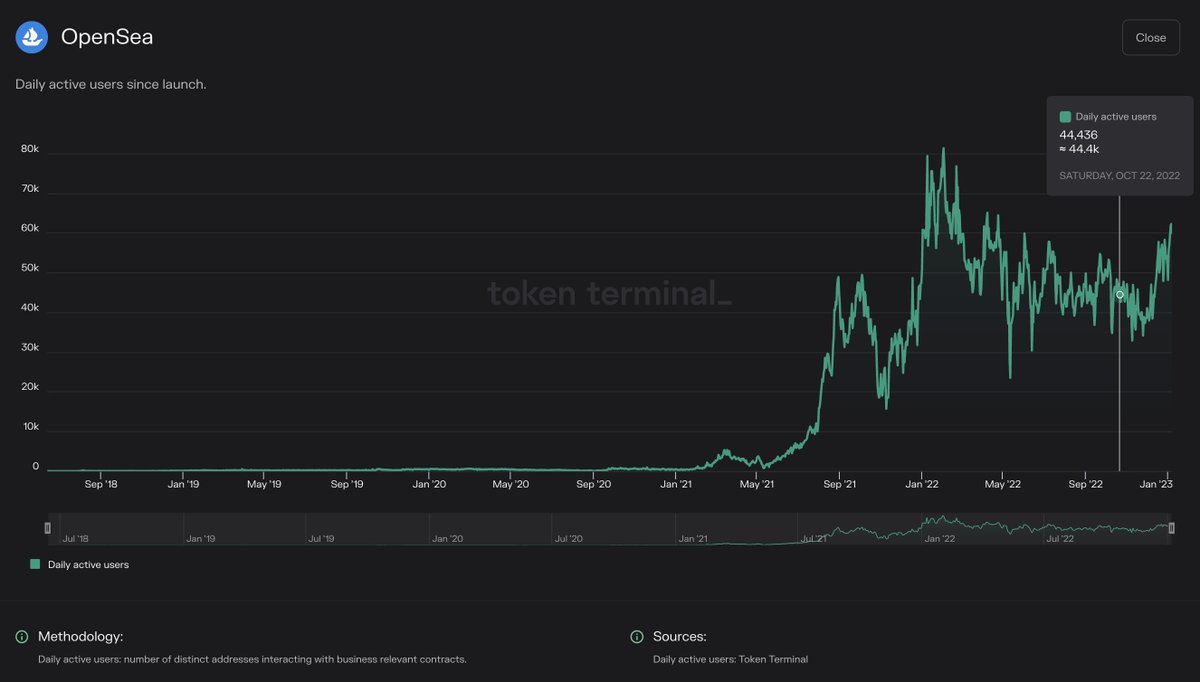
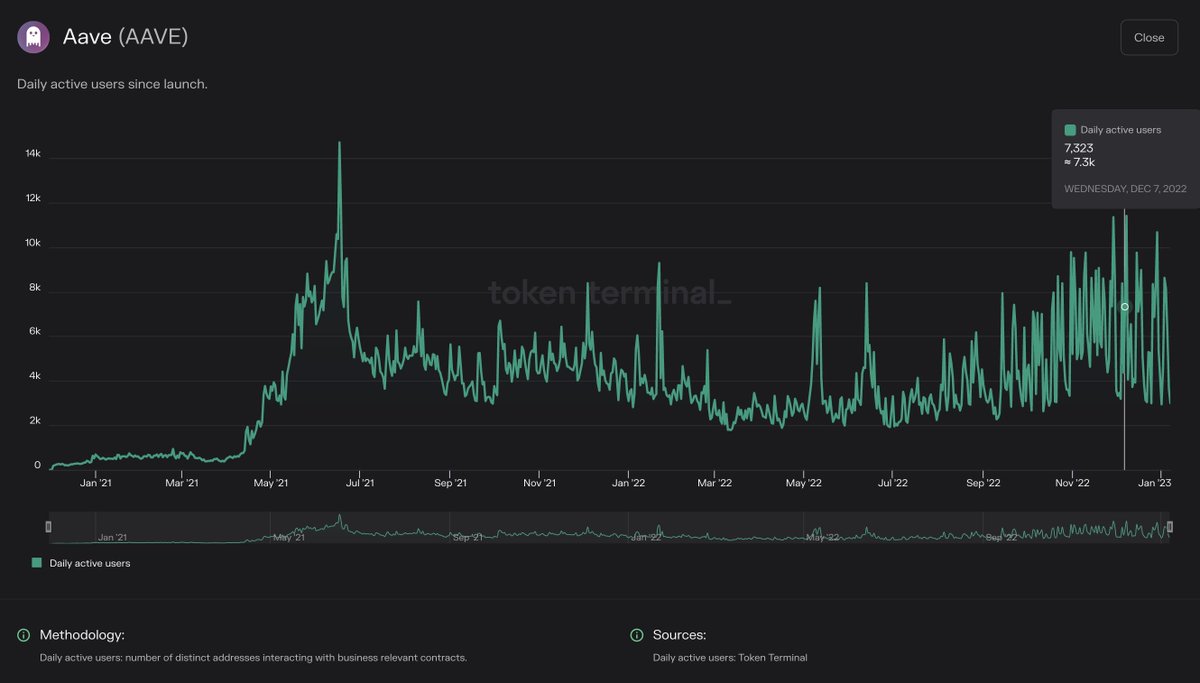
Current aggregate: DAU figure Currently, there are ~2.5M daily active users among the most widely used protocols.
Active developers: This metric tells us how many developers are working on building the core protocol. It’s a good proxy for “developer leverage” when viewed alongside other fundamentals. E.g. fees, revenue, or earnings per developer.
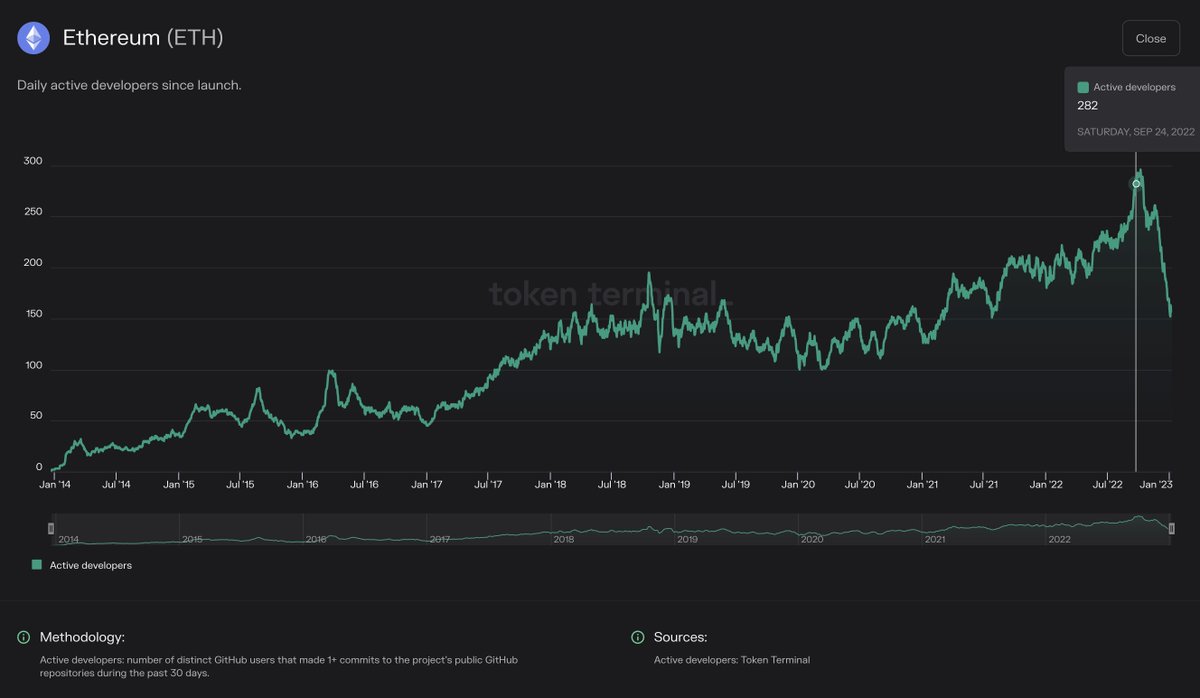
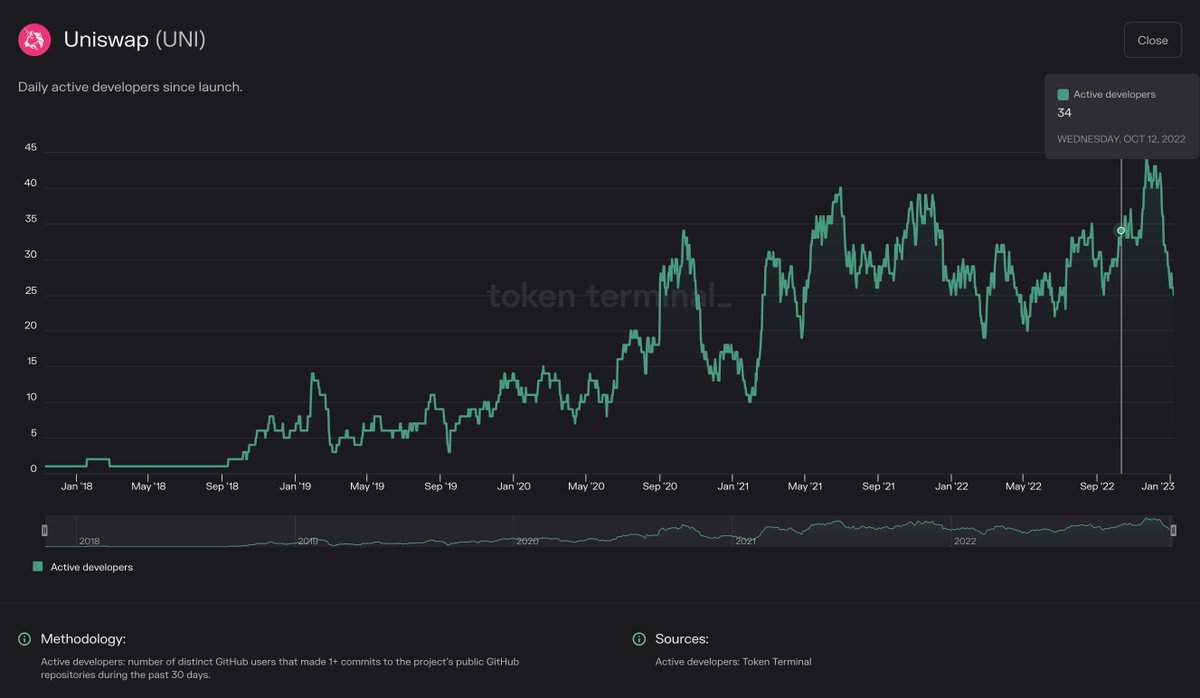

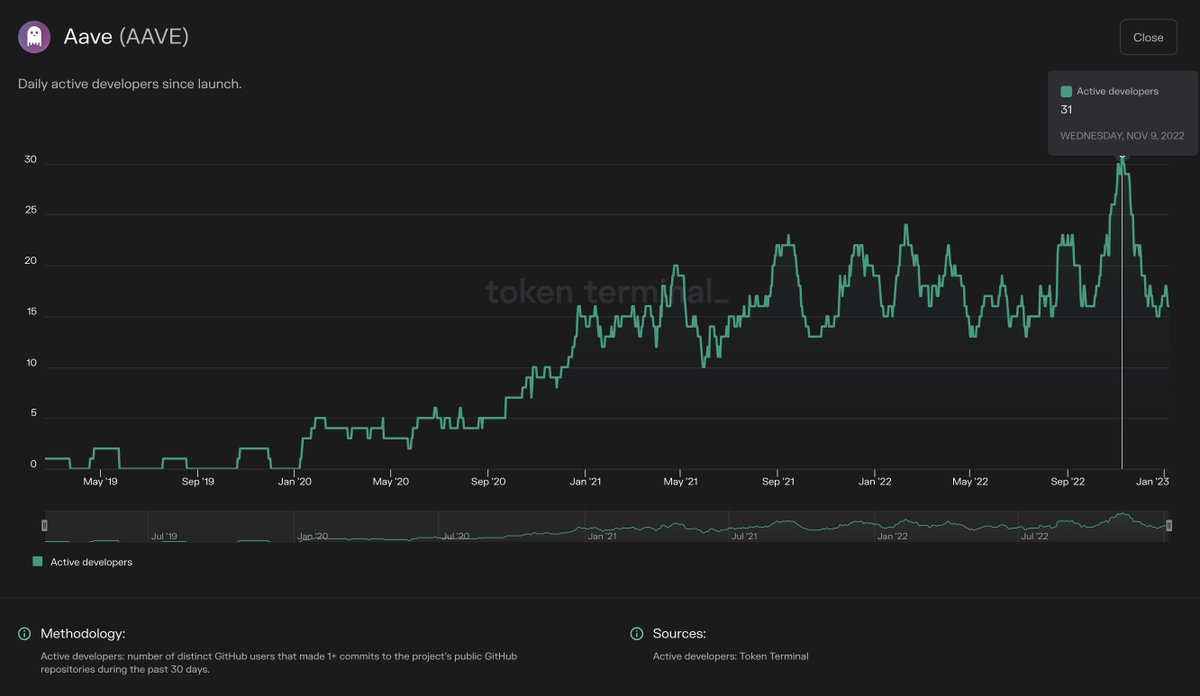
Current aggregate active developer figure : Currently, there are ~1.7k active (core) developers working on the most widely used protocols.

